What Winter Storm Fern Reveals about Interior Water Losses and Systemic Risk


ZestyAI Product Insights
Winter Storm Fern has evolved into a historic catastrophe for the U.S. insurance industry. Between January 23-27, 2026, the storm shattered records by placing over 230 million Americans under severe winter alerts, with a death toll of 85 as of February 3rd.
Preliminary industry estimates place insured losses at $6.7 billion, potentially making Fern the third-costliest U.S. winter storm on record, trailing Elliott (2022) and Uri (2021). The crisis is far from over. The National Weather Service warns of a "historic duration" of extreme cold, with temperatures 15 to 25 degrees below average, that continues to hamper mitigation efforts.
For carriers, Fern is a complex, multi-peril challenge. Claims teams are navigating a surge of freeze-related losses, ice-driven structural damage, and widespread business interruptions across 34 states.
To understand the stakes, one needs to look no further than February 2021, when Winter Storm Uri brought Texas to its knees and generated over $11 billion in insured losses from a single state. Fern’s footprint is broader, and its secondary effects are still unfolding.
The Cold Hard Numbers from Storm Uri: Why Claims Explode Below 5°F
Our analysis of the 2021 Storm Uri reveals a striking relationship between temperature deviation and claim frequency for the non-weather water and freeze perils. Using data from multiple carriers, we tracked daily claim rates against minimum temperatures: before, during, and after the storm window (February 11-20, 2021).
The results show how rapidly falling temperatures can transform a routine winter pattern into a systemic loss event, allowing us to monitor the market’s response in real-time as conditions deteriorated, peaked, and normalized.
The results are dramatic:
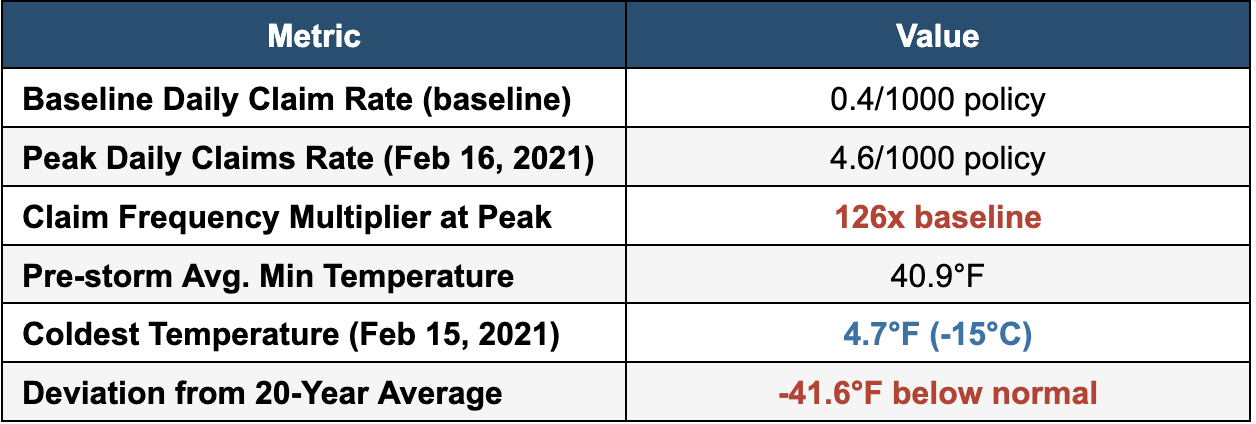
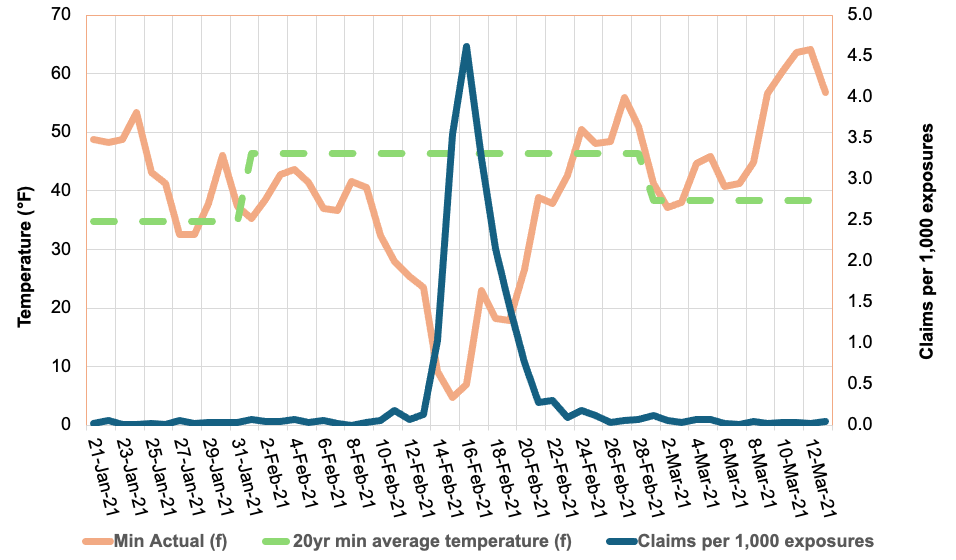
Figure 1: Daily claim rates (blue line) surged 126X above the baseline in a temporal spike as temperatures (orange line) plunged below the 20-year average (dashed green line) during Winter Storm Uri.
The chart reveals a clear inverse relationship: as minimum temperatures dropped from the mid-40s°F to below 5°F, daily claim rates didn’t just rise, they increased 126X, from a baseline of 0.04% to 0.46% at the peak. This dramatic surge underscores the significant consequences of extreme cold events on insurance liability.
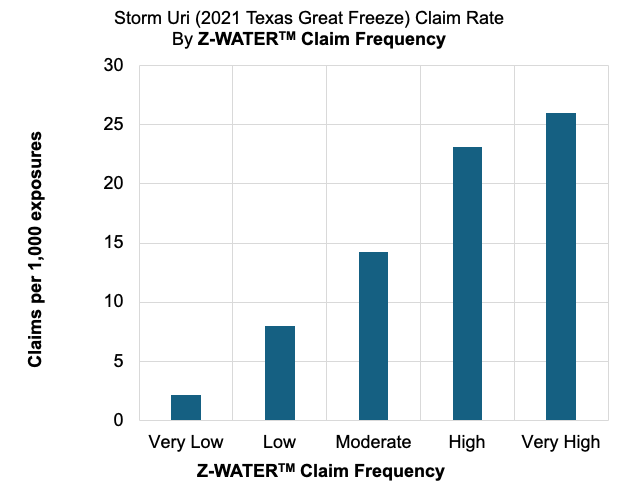
Figure 2: ZestyAI’s Z-WATER™ demonstrated an 11X increase in claim frequency between ‘Very High’ and ‘Very Low’ risk tiers during Winter Storm Uri
We used ZestyAI’s Z-WATER™ to segment the property-specific non-weather water risk across the 10-day storm window. Z-WATER™ is a risk model that accounts for how plumbing design, local climate, and infrastructure reliability interact to drive non-weather water and freeze losses. By capturing real-world dynamics, such as temperature swings that stress pipes and electrical grid failures that amplify claims, the model delivers a scientifically grounded view of property-level risk.
The results were definitive: properties that Z-WATER™ scored as ‘Very High’ risk filed 26 claims per 1,000, compared to just 2.2 claims per 1,000 for those scored as ‘Very Low’, an 11X increase in claim frequency.
This accurate segmentation reveals a clear path to managing volatility. Z-WATER™ provides a deep understanding of a home’s resilience across the full spectrum of loss mechanisms, from everyday plumbing failures to expensive outlier events like Storms Uri and Fern. By enabling precise intra-territory risk splitting, the model allows carriers to price and underwrite more reliably, ensuring premiums reflect the true risk profile while protecting the portfolio against systemic losses.
The January 2026 Storm: History Rhyming?
While we can already see the immediate impact of Winter Storm Fern, the primary difference between Fern and Winter Storm Uri is the duration of the freezing event itself, rather than any changes in how quickly policyholders are filing their claims.
As shown in Figure 1, NWW claims rise rapidly as temperatures fall and taper off quickly once conditions normalize. The risk in prolonged cold events lies in how long properties stay below the Plumbing Design Temperature; the longer the freeze, the greater the likelihood of systemic plumbing failure.
During Winter Storm Uri, extended sub-freezing conditions significantly increased the number of days in which vulnerable properties were exposed to frozen pipe failures, driving aggregate losses to historic levels. Fern is now exhibiting a similar duration profile, with sub-freezing conditions persisting for up to 10 consecutive days across parts of the Northeast. The National Weather Service has warned this “could be the longest duration of cold in several decades,” raising the likelihood of elevated losses even if individual claims remain tightly clustered in time.
For carriers, the warning signs are already flashing:
- The Power Failure Multiplier: During the storm's peak, over 1 million customers lost power. In the South, where homes lack the heavy thermal insulation of northern properties, a power outage is the primary driver of catastrophic pipe bursts. Without active heating, a property can reach the "burst threshold" within hours.
- The $30,000 Claim Severity Benchmark: Recent State Farm data underscores the high stakes of these events. Winter water damage claims totaled over $628 million, with the average claim payment now exceeding $30,000. For carriers, this high per-claim severity means even a moderate frequency surge can quickly erode Q1 margins.
- Regional Fragility in the South: While the initial assessments are still surfacing, early industry estimates for privately insured losses from Winter Storm Fern puts the damage at $4 billion to $7 billion. With Texas and Tennessee identified as the hardest-hit states, carriers are facing a "Uri-style" scenario in which infrastructure wasn't designed for a 10-day deep freeze.
From Reactive to Predictive: Solving the $6.7 Billion Freeze Risk Equation
The 2021 Texas freeze taught us that traditional approaches to freeze risk are highly insufficient. Many properties that experienced burst pipes were in areas that rarely see extended freezing temperatures, meaning they lacked adequate winterization.
This is where predictive analytics becomes essential. By modelling the interaction between property-level vulnerabilities and local temperature thresholds, carriers can better identify which properties are most vulnerable to freeze events before the damage actually occurs.
Key Risk Drivers Identified in Our Latest Analysis:
- The Design Mismatch: The greatest risk isn't just the cold; it's the sudden change in temperature. Properties in states like Texas or Tennessee face a higher risk because they are built to release heat, not trap it. They lack the heavy insulation and deep-buried pipes needed to survive a 10-day freeze.
- The Power Grid Vulnerability: Our analysis shows that areas prone to power outages face a compounded risk. In the South, a home’s primary defense is its heating system so when the power fails and the heater stops, the "burst threshold" can be reached in just a few hours.
- Building Vulnerabilities: Our analysis shows that older homes and properties with plumbing routed through exterior walls are disproportionately represented among $30,000 non-weather water losses.
The Bottom Line for Carriers
The 2021 Texas freeze was a pivotal moment for the industry, generating more than 500,000 claims and $11.2 billion in insured losses in a single state. Today, Winter Storm Fern represents an even broader systemic threat, with weather alerts impacting 230 million people across more than 30 states.
While the final tally for Fern is still developing, the data is already clear: temperature shocks drive claims at exponential rates. With early industry assessments estimating privately insured losses between $4 billion and $7 billion, it is evident that the prolonged duration and geographic anomaly of extreme weather events are the primary drivers of this volatility.
For carriers looking to protect their Q1 margins, predictive analytics are no longer a luxury; they are a requirement. By analyzing property-level characteristics, regional vulnerabilities, and historical temperature deviations, you can move from reactive claims handling to proactive risk management.
The question isn't whether another major freeze will occur, but whether your portfolio is prepared for the next 126-fold surge.
Learn More About Z-WATER
ZestyAI’s Z-WATER™ provides the industry’s most granular view of interior water risk, helping carriers accurately and reliably assess properties in areas prone to temperature shock events. By analyzing detailed property-level characteristics alongside historical weather patterns and regional risk factors, our advanced models predict the likelihood of Non-Weather Water (NWW) and freeze claims as well as their associated severity. This deeper level of analysis empowers carriers to make smarter pricing decisions before the next major storm hits.
Methodology: Analysis based on aggregated claims from multiple Texas carriers during Winter Storm Uri (February 2021). Temperature data reflects mean daily minimums across the exposure footprint, weighted by ZIP Code to account for geographic density. The claim/exposure ratio was calculated by dividing daily claims by the average policy-day exposure.
-----------------------------------------------------------------
1CNN Weather, "More than 230 million people under alerts for potential ice, heavy snow and extreme cold," January 2026. [link]
2Fox News, "Noem coordinates with Mississippi officials as state recovers from deadly winter storm," January 2026. [link]
3Insurance Innovation Reporter, “KCC Estimates $6.7 Billion in Insured Losses from Winter Storm Fern,“ February 2026 [link]
4Texas Department of Insurance, "Insured Losses Resulting from the February 2021 Texas Winter Weather Event," March 2022. [link]
5Fox Business, “More than 1 million Americans lose power as monster winter storm sweeps across the US,” January 2025 [link]
6Carrier Management, “Frozen Pipes Lead to $628M in Losses for State Farm,” January, 2026 [link]
7 Barrons, “Winter Storm Fern Packed a Wallop. Now the Cost Estimates Are Rolling In.,“ February 2026 [link]
